The hitchhiker's guide to LLVM debugging tools
2025-08-20
Prologue
Hello everyone, how's everybody doing? I'm still chugging away at solving LLVM issues at Igalia :) Fall and winter's coming soon, and I can't wait to go travel and enjoy life. Hahaha Boston here I come :) Welp, another year a few more blogs am I right hahahahhaa.
A few weekends ago, I went up to Thousand Oaks and Malibu beach to visit my friend from Berkeley and then took an Amtrak with a date to San Diego. Isn't life just beautiful like that? I couldn't have asked for more.
As tradition, here's a song and another song for interested readers :) I hope everyone enjoys :)
Introduction
Debugging has always been a quintessential tool in a software engineer's toolboxes. As a piece of software or framework gets more complicated, the flow of a program invariantly gets more complex, which requires software engineers to careful and methodically investigate an issue/bug instead of blindly following one's instinct.
With how much time LLVM's been in development for, it evidently provides a wide range of tools to help a developer with problem-solving when encountering a bug at run time or when an issue is filed.
In this sense, although the article title is about "debugging", the article inherently and inadvertently talks about problem-solving instead. I guess I lied hahahahahhaha.
I hope this helps junior LLVM developer or low level developer just starting out in their journey!
Welp, let's dig in!
Compiling and testing time
Compile time on a big codebase has always been a pain point for programmers. A few seconds here, a few minutes there, and you have wasted at least half an hour extra waiting to compile the LLVM repository. Once you hit compile, if you have to wait a while, your mind wanders away to other things, and you start to drift away, thinking about other topics. Point is, the context switching causes you to lose out on your focusing power.
Compiling takes more time -> You have to wait longer -> Less time to run the code to experiment and debug -> cannot problem solve.
The following subsections then describes how to save time on your compiling and executing. This will reduce your development cycle time and hopefully increase your productivity.
(Release + Assertion) + (Debug)
A common rule of thumb to have is that a codebase should be built in Debug mode when you're in development, and then in Release mode when you're shipping to users. But this is not always the case...
If you're not stepping through the code with the LLDB debugger, chances are the trade-off of being in Debug mode such as receiving accurate stack trace locations and source layout position is not worth it. Without going much into it right now, the LLVM codebase provides much diagnostics help so that a majority of the time, stepping through the debugger is not necessary.
Debug mode takes longer to compile and link, test cases with Debug mode are often compiled and ran slower. On the other hands, Release mode with assertion turned on compiles and run tests much faster without sacrificing much diagnostics.
Therefore, it's very beneficial to have two build modes when contributing to LLVM. You can set the modes for your build by appending these two options when configuring CMake
Debug : -DCMAKE_BUILD_TYPE=Debug
Release + Assert : -DCMAKE_BUILD_TYPE=Release -DLLVM_ENABLE_ASSERTIONS=ONBuild your target/subproject only
You can also save on your development time by only building the subproject that are of interests to you.
For example, if you're doing the majority of the work on the Webassembly or X86 target, you often don't have to enable the RISCV target and build RISCV source files on top of it. Enabling extra targets will also enable extra tests for that target.
The flag to include/exclude subprojects is LLVM_TARGETS_TO_BUILD
Here's an excerpt from LLVM:
Semicolon-separated list of targets to build, or all for building all targets. Case-sensitive. Defaults to all. Example: -DLLVM_TARGETS_TO_BUILD="X86;PowerPC".
The full list, as of March 2023, is: AArch64, AMDGPU, ARM, AVR, BPF, Hexagon, Lanai, LoongArch, Mips, MSP430, NVPTX, PowerPC, RISCV, Sparc, SystemZ, VE, WebAssembly, X86, XCore.
Use LLVM-release compilers
If you're using a package manager's clang or a clang that comes with your operating system, chances are you're losing out
on development time.
With PGO, BOLT and various tips and tricks turned on, LLVM maintainer and volunteers have been hard at work optimizing the LLVM official release version of clang to be highly optimized for the LLVM compiler development experiment. How good is it? You can see for yourself with the claim from the BOLT paper
For datacenter applications, BOLT achieves up to 7.0% performance speedups on top of profile-guided function reordering and LTO. For the GCC and Clang compilers, our evaluation shows that BOLT speeds up their binaries by up to 20.4% on top of FDO and LTO, and up to 52.1% if the binaries are built without FDO and LTO.
Unfortunately, for macOS users, BOLT only comes with Linux x86 and AArch64. However, I'd still recommend downloading your OS's version of the compiler from LLVM's release page as anecdotally, I can still feel some extra perform when compiling LLVM.
After you've downloaded the LLVM release compiler to a folder, you can use it in your CMake configuration command as follows:
-DCMAKE_C_COMPILER=$HOME/Developer/igalia/LLVM-20.1.7-macOS-ARM64/bin/clang \
-DCMAKE_CXX_COMPILER=$HOME/Developer/igalia/LLVM-20.1.7-macOS-ARM64/bin/clang++provided that you download and extract it to a folder of $HOME/Developer/igalia/LLVM-20.1.7-macOS-ARM64
Btw, I learned about this through my conversation with David Spicket:
bdbt: I'm new grad and joining a company as a compiler engineer, would compiling a new, separate compiler that's BOLT-activated specifically for compiling compiler makes sense? It will give me a sizable reduction in compile time and allow for faster iteration, but I'm not sure if there will be errors when using the special version? any insights would be appreciated
David Spicket: At least for Linux x86 and AArch64, LLVM's release archives on GitHub are already BOLT-ed (you can check with objdump -h clang | grep bolt). So if there are potential issues, we're all at risk 🙂 If you want to try BOLT-ing something yourself, https://github.com/llvm/llvm-project/blob/main/bolt/docs/OptimizingClang.md seems like a good place to start (I've not done this myself).
ccache, ninja and LLD
Haha, you thought we were done huh. Even on top of all this, we can use extra tools to squeeze out extra time in our day-to-day work.
ccache
For increment builds, ccache "speeds up recompilation by caching previous compilations and detecting when the same compilation is being done again."
Behind the scene, if not hashing based on inode (minimal accuracy), ccache will hash either the text directly or the preprocessed source code after compiler invocation (more accurate hashing). At the time of writing this article (Aug 2025), a new paper has come out in July 2025, proposing even higher hash accuracy meanwhile driving down total time saving by proposing hashing on LLVM IR instead of source code or AST. Here is an excerpt from said paper:
We demonstrate its accuracy and end-to-end savings in comparison to Ccache and cHash on the development history of 16 open-source projects. With an average build time reduction of 19% across all C projects, IRHash provides better end-to-end savings than Ccache (10%) and cHash (16%), while additionally supporting more languages.
Anyways, in my use case, when compiling the codebase from different commits (because some branches are opened a few weeks ago and some are opened recently after I have git pull from upstream),
compiling the same build folder would often take a lot of time. This is where ccache comes in.
You can use the LLVM's flag for ccache together with other CMake flags -DLLVM_CCACHE_BUILD=true.
In addition to this, you can create a ccache configuration in $HOME/.ccache/ccache.conf, allowing more flexibility and power to ccache.
file_clone = true
inode_cache = true
max_size = 200G
base_dir = /
absolute_paths_in_stderr = trueBelow, I'll provide the explanation for each configuration option.
file_clone = true: performs copy-on-write if possible, improving the caching performance.inode_cache = true: instruct ccache to cache a file based on its device, inode and timestamps. This cuts down on time spent hashing files and therefore improves caching performance since some files in LLVM can contain tens of thousands of lines.max_size = 200G: allocates 200 gigabyte of storage on your computer for ccache to use.base_dir = /: allows caching of all directories (any directory's path that starts with /).absolute_paths_in_stderr: instruct ccache to rewrite relative paths to absolute paths in a compiler's textual output in lieu of incorrect relative paths in warning or error messages.
I want to thank my colleague Alex Bradbury for introducing me to these options :)
Ninja
Ninja's a build system that's focused on speed and is designed run builds as fast as possible.
From Ninja's wikipedia:
In essence, Ninja is meant to replace Make, which is slow when performing incremental (or no-op) builds. This can considerably slow down developers working on large projects, such as Google Chrome which compiles 40,000 input files into a single executable. In fact, Google Chrome is a main user and motivation for Ninja. It's also used to build Android (via Makefile translation by Kati), and is used by most developers working on LLVM.
You can opt to use Ninja when configuring CMake with -GNinja and build your code with another separate command
ninja -C <your_build_folder> <your_build_target>
For example, to build the codebase and test everything:
ninja -C build check-allLLD
From the LLVM's LLD page:
LLD is a linker from the LLVM project that is a drop-in replacement for system linkers and runs much faster than them.
In fact, it is so fast that I think it's a necessity to enable this by default when developing LLVM, especially when your lld executable comes from the LLVM release page that has PGO and BOLT enabled, providing even faster linking time.
As of Monday, August 11, 2025, here is the comparison from the LLVM LLD page, with the percentage difference between ld, gold and lld.
| Program | Output size | GNU ld (time) | GNU gold w/ threads (time) | lld w/ threads (time) |
|---|---|---|---|---|
| ffmpeg dbg | 92 MiB | 1.72s, (4.91x) | 1.01s, (2.89x) | 0.35s (1.00x) |
| mysqld dbg | 154 MiB | 8.50s, (12.50x) | 2.68s, (3.94x) | 0.68s (1.00x) |
| clang dbg | 1.67 GiB | 104.03s, (19.70x) | 23.49s, (4.45x) | 5.28s (1.00x) |
| chromium dbg | 1.14 GiB | 209.05s, (12.52x) | 60.82s, (3.64x) | 16.70s (1.00x) |
You can enable the LLD linker with -DLLVM_USE_LINKER=lld
Grepping
Well, now all that's out of the way, let's talk about grepping.
In a big and unfamiliar codebase, sometimes, you just don't have much of a clue on how things go. In cases like this, you can start querying random keywords that are related to your issue and work your way from there.
Sometimes, it just so happens that when you're querying a function that's used in a test case via an LSP, the LSP gives you the source from the OS compiler or the LLVM release compiler (since you built the project with it), grepping might be one of the few ways to get you to the function's source in the repository instead.
In my case, I opt for ripgrep instead of grep due to the performance difference.
With such aforementioned importance, often in the following sections, I will try to provide how grepping integrates with each area.
Git potpourri on the pull requests
For a beginner in a codebase (even a seasoned programmer), the ability to obtain more information and context, extending further than the code sitting in front of them, is extremely helpful. This section then talks about how to find new extra information with git when browsing the codebase.
Blame & show a commit
When exploring a new area/file, I would often combine git blame together with git show to obtain more context for what I'm working with.
The workflow is: git blame the file -> get the commit hash for the line I'm interested in -> input the commit hash to git show
In investigating an issue through commits, it's also helpful to look up on the internet for the commit's pull requests, either through GitHub or through reviews.llvm.org, often known back then as Fabricator.
Backstory time: Before roughly 2020, pull requests to LLVM are through Fabricator (reviews.llvm.org). Due to how long LLVM's been in developement, it is often the case that the last time a line of code's been touched by a PR is through Fabricator. Thus, if you couldn't find the pull request of the current commit hash through GitHub, a good place to try is Fabricator. In a PR back then, the Fabricator link of the pull request would often be included in the commit message as well.
For example, in this pull request, the author and reviewers have added a TODO, but without reading the PRs, the TODO would seem very unclear and hazy, leaving code readers wanting more context.
In other words, exploring code is the first step, after that, commit messages provides greater additional context on the problems being solved and finally, the pull request and the reviews.llvm.org provides opinions and directives.
grepping it
With trying to explore what's happening for a subproject/subsection in LLVM, you can also utilize grepping in git instead of going through the GitHub online gui.
Belows shows a picture of me applying git grep to the topic of WebAssembly where there's a mention of either "fold" or "DAG" via this command:
git log --grep='WebAssembly' --grep='fold\|DAG' --all-match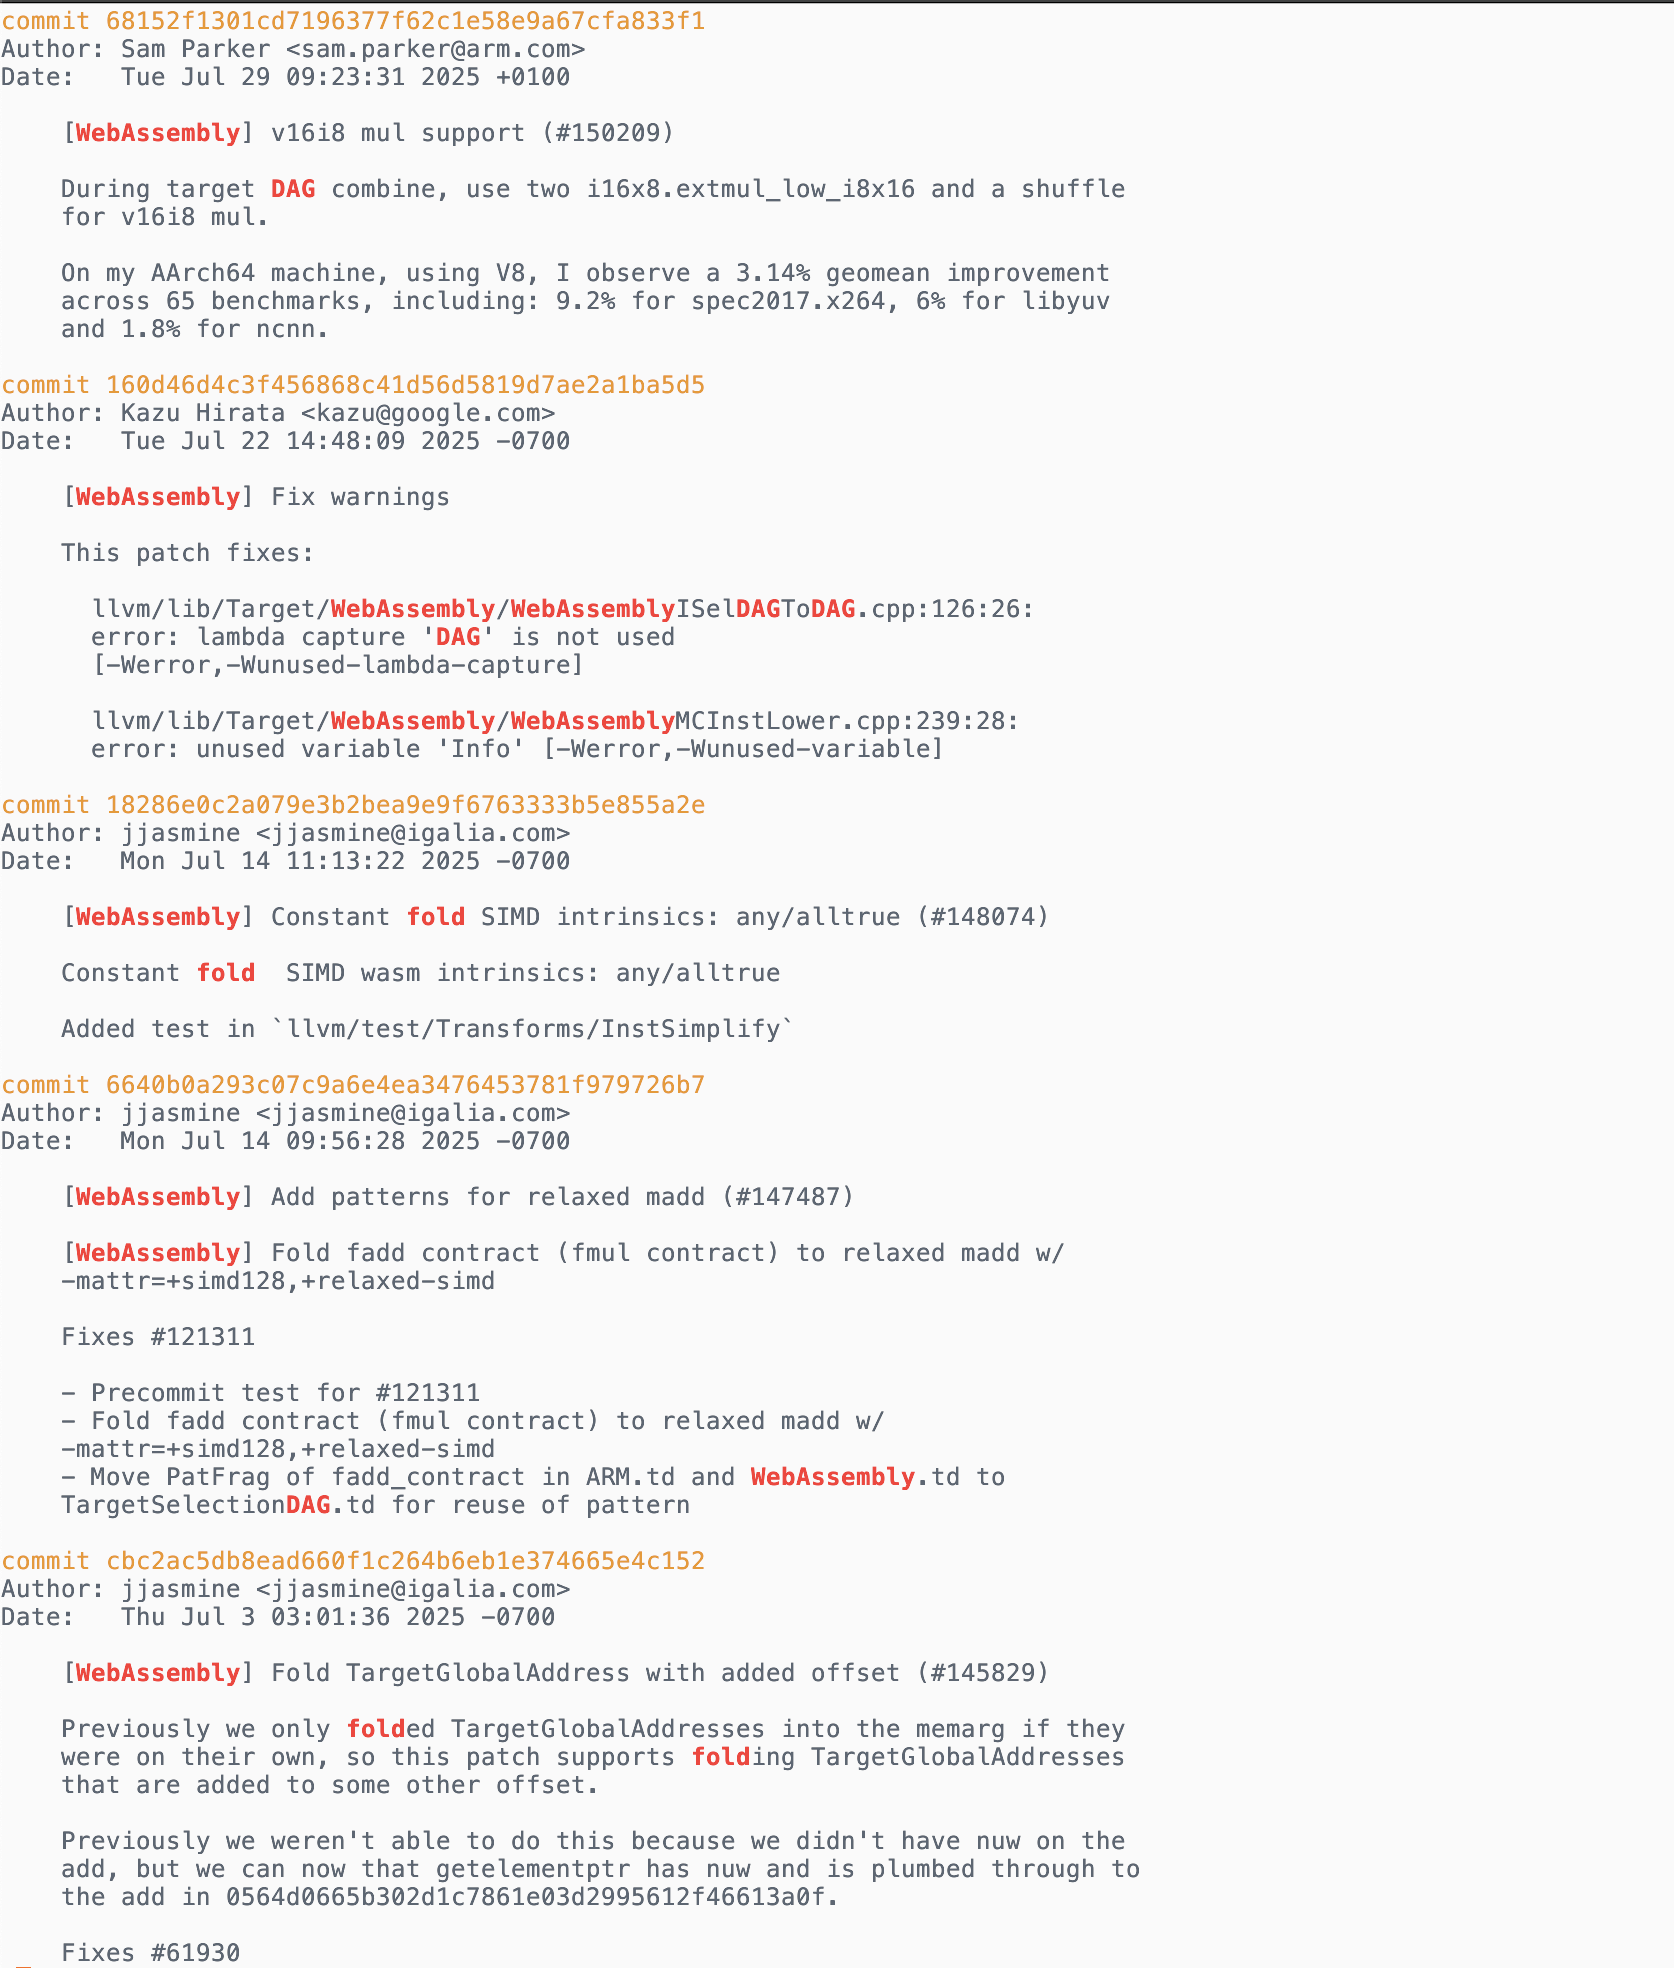
godbolt, -debug-only, -print-after-all, -print-changed and all that
If you haven't heard of godbolt, think of it as a way for compiler developer to say no to "but but but it works on my machineeee :("
Formally, godbolt is an interactive online compiler which shows the assembly output of compiled C++, Rust, Go (and many more) code.
Buttt, such a simple description couldn't possibly do the site its justice;
besides linking this entertaining video, this section also highlights some of the helpful tooling of godbolt.
While the goal in the section is to introduce to newcomers of LLVM to the godbolt tool, it's also helpful to guide
beginners to how to simulate such behavior locally on their machines via the command line.
Welp, let's get to it.
Mapping
First feature that I have found very useful from godbolt is the ability to point out which line of high level code is responsible for which line of low level code (i.e. llvm ir or assembly code). This helps developer cuts down on trying to identify which block of assembly code is responsible for
This is enabled by default and might be overlooked; thus, let's look at example.
In ClangIR's issue 1807, I needed to code gen the builtin setjmp to Clang IR.
The only problem is, I didn't know much about setjmp and I didn't know how clang does it originally. Godbolt then helped me do this
by isolating how the setjmp builtin is codegen'd on clang originally.
With the feature from godbolt, I quickly identified how to lower setjmp in ClangIR.
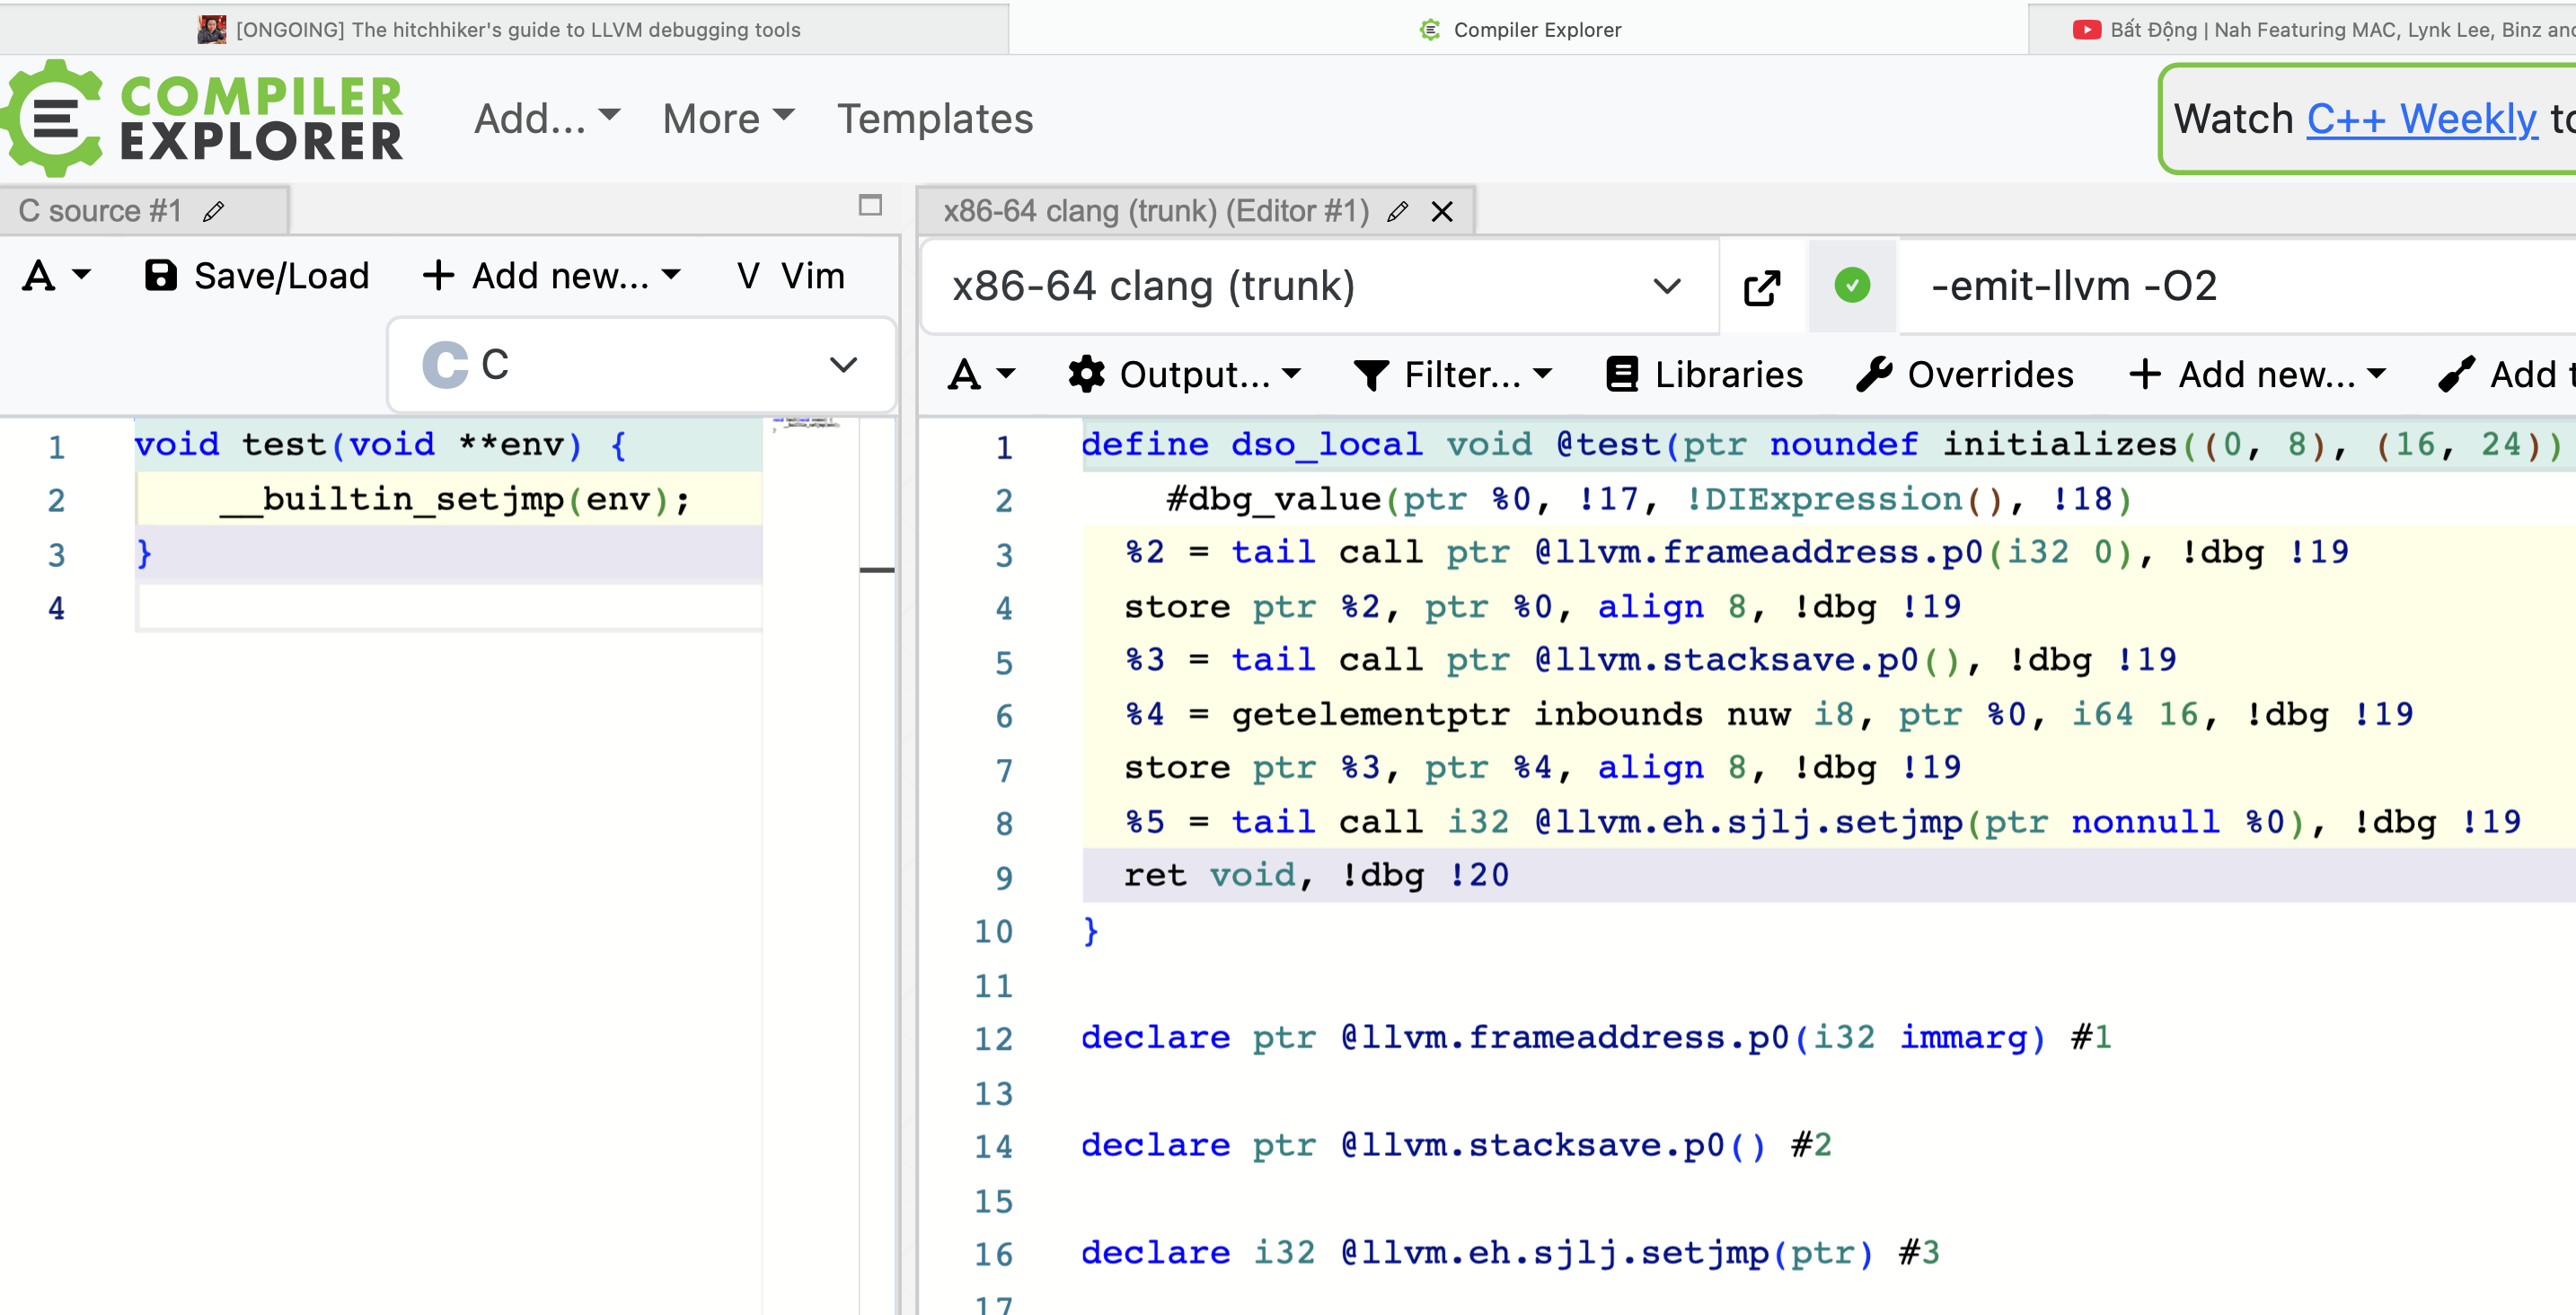
The above picture shows godbolt each section in C code and in LLVM IR being color-coded. More specifically:
- The light turquoise color maps line 1 in C to line 1 in LLVM IR.
- The yellow color maps line 2 in C to line 2-8 in LLVM IR.
- The purple color maps line 3 in C to line 9 in LLVM IR.
To the best of my knowledge, I'm not sure if there's a way to do this via the CLI command line tool in a few easy steps?!
Inspecting IR changes and cutting out the noise
With godbolt, you can also see how each optimization passes through opt affects your current LLVM IR.
In the following picture, you can see we can access the LLVM IR diff through the plus sign button.
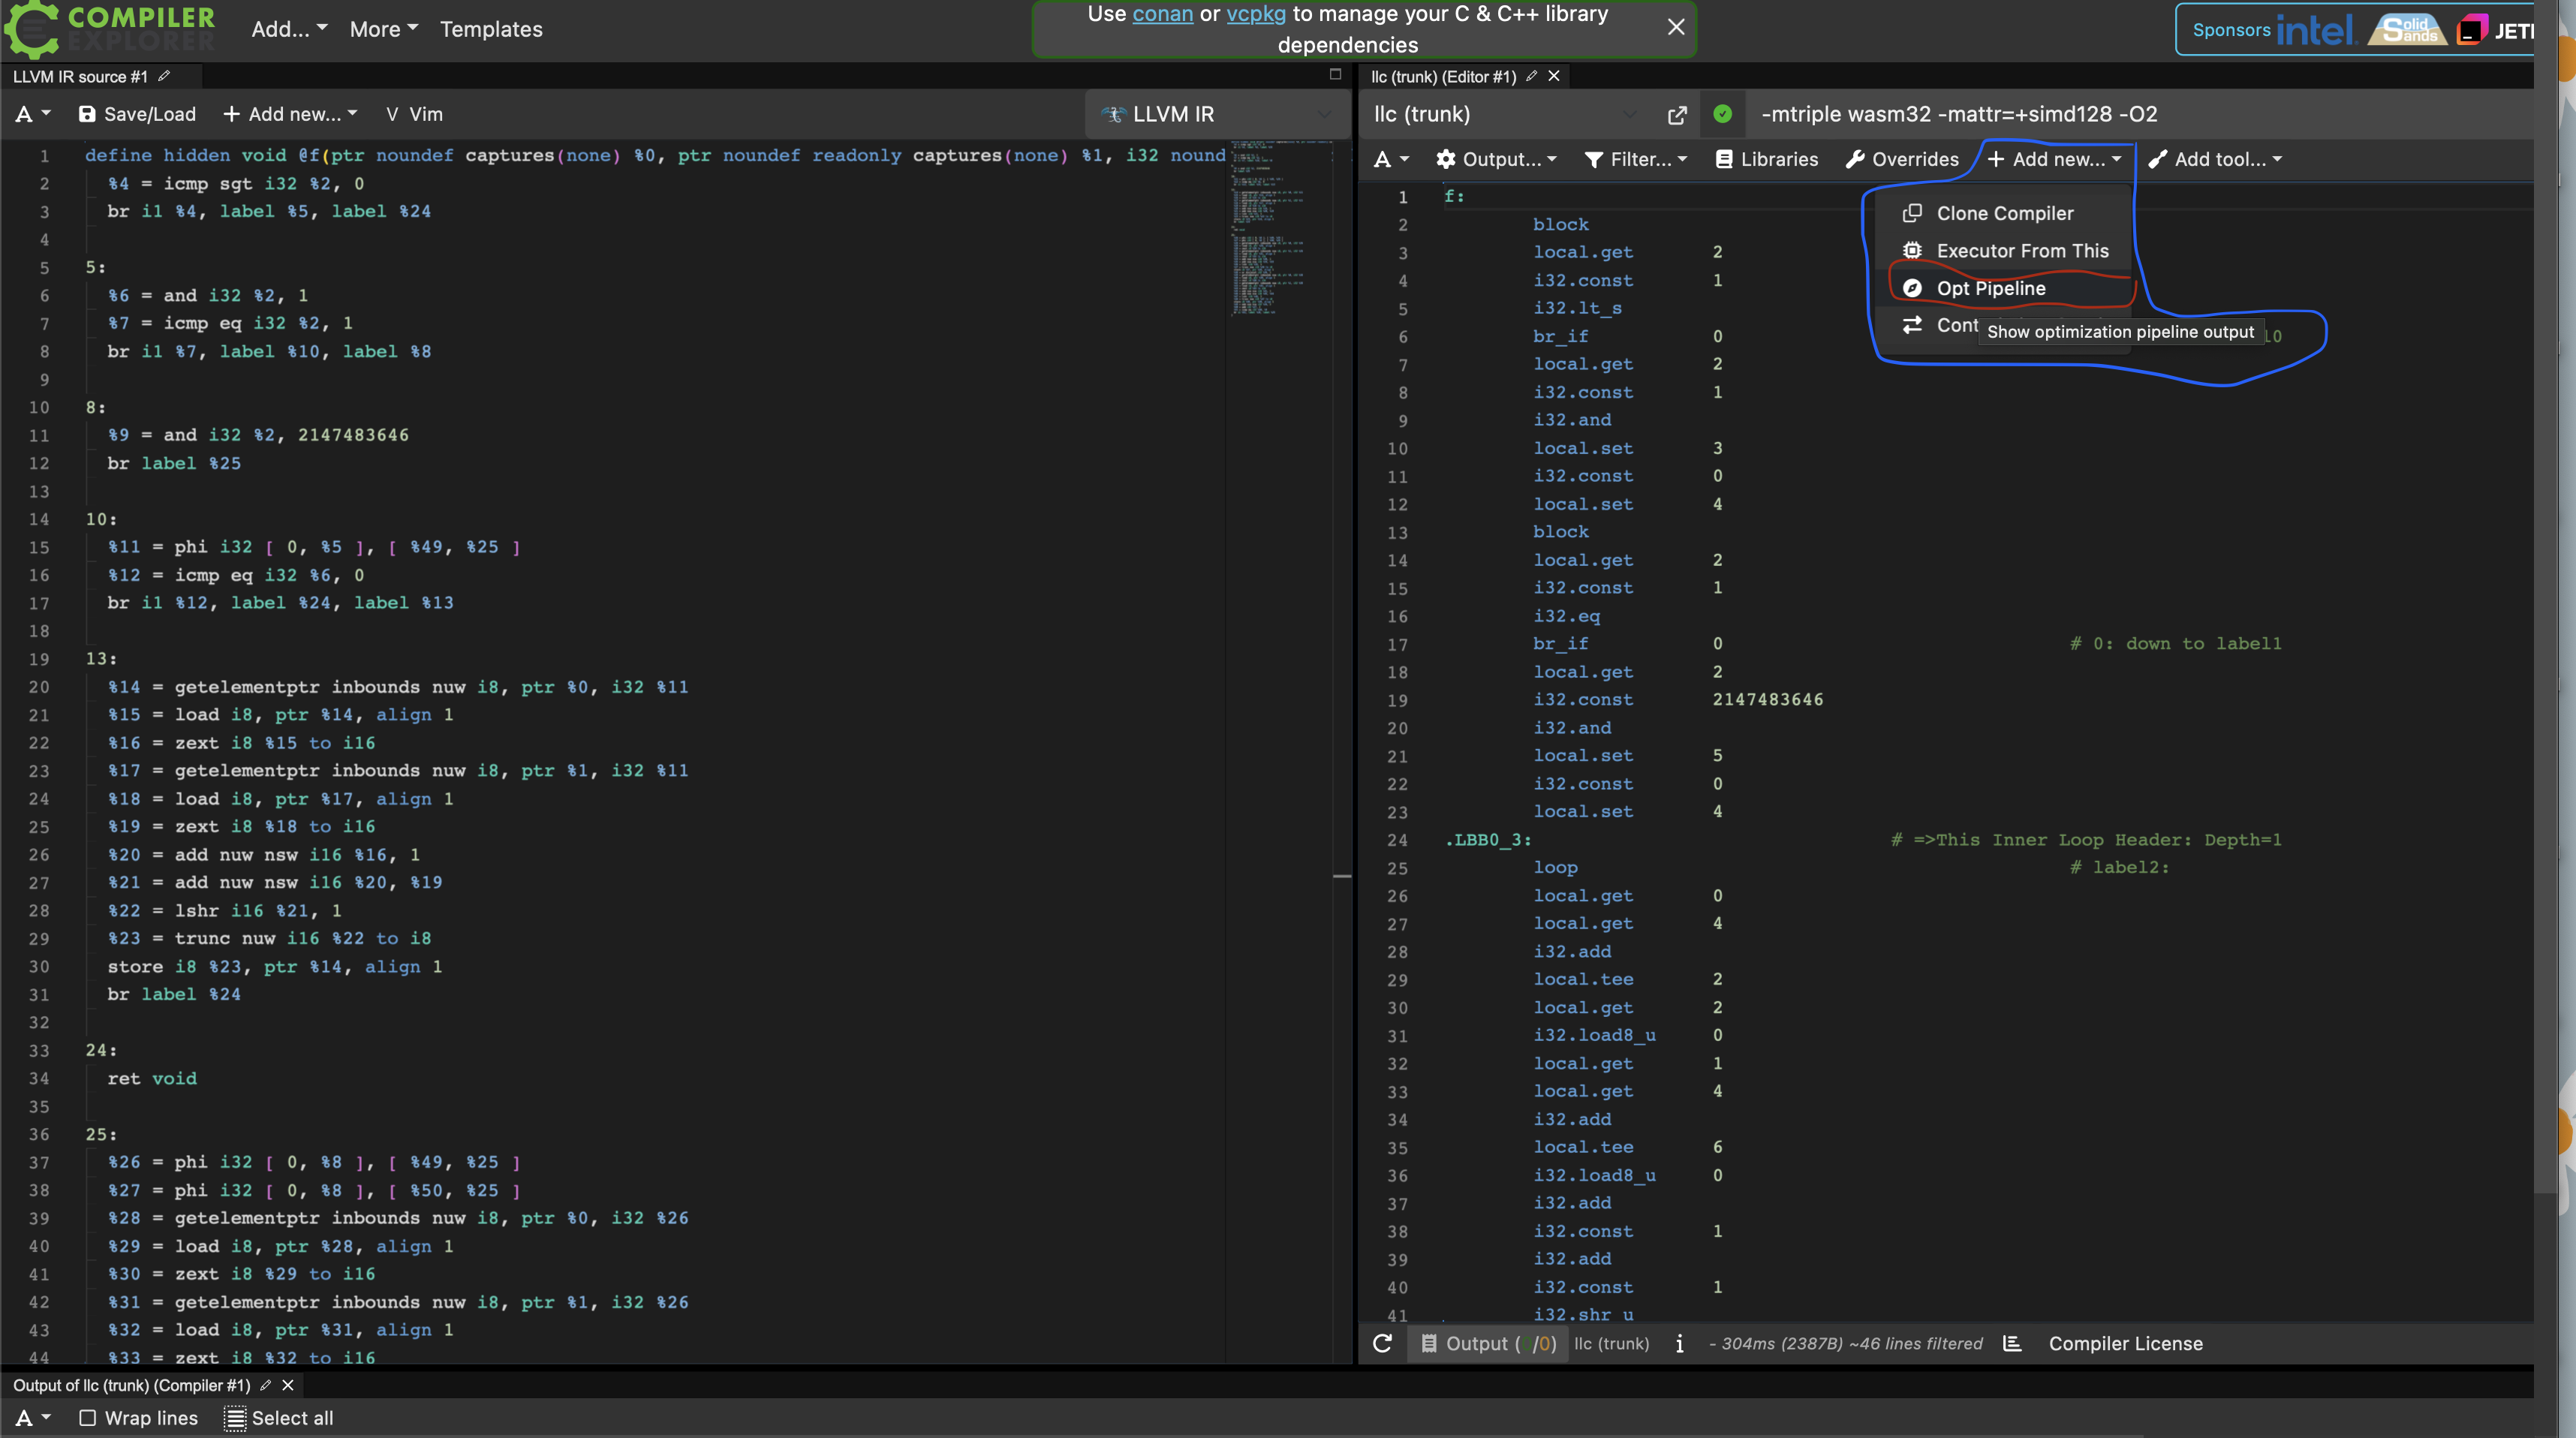
After clicking on the Opt Pipeline option, you can now scroll through and see which optimization passes changes your
LLVM IR.
If a pass changes your intermediate representation, it'll light up green on the left column and generate the diff so you can more easily realize where a change happens.
Here, the pass Loop Strength Reduction is affecting the IR in the function f. Next to the colum displays the LLVM IR of
the current function. If the pass changes the IR, then the area is split into two columns to show the diff line by line,
before and after applying the pass:
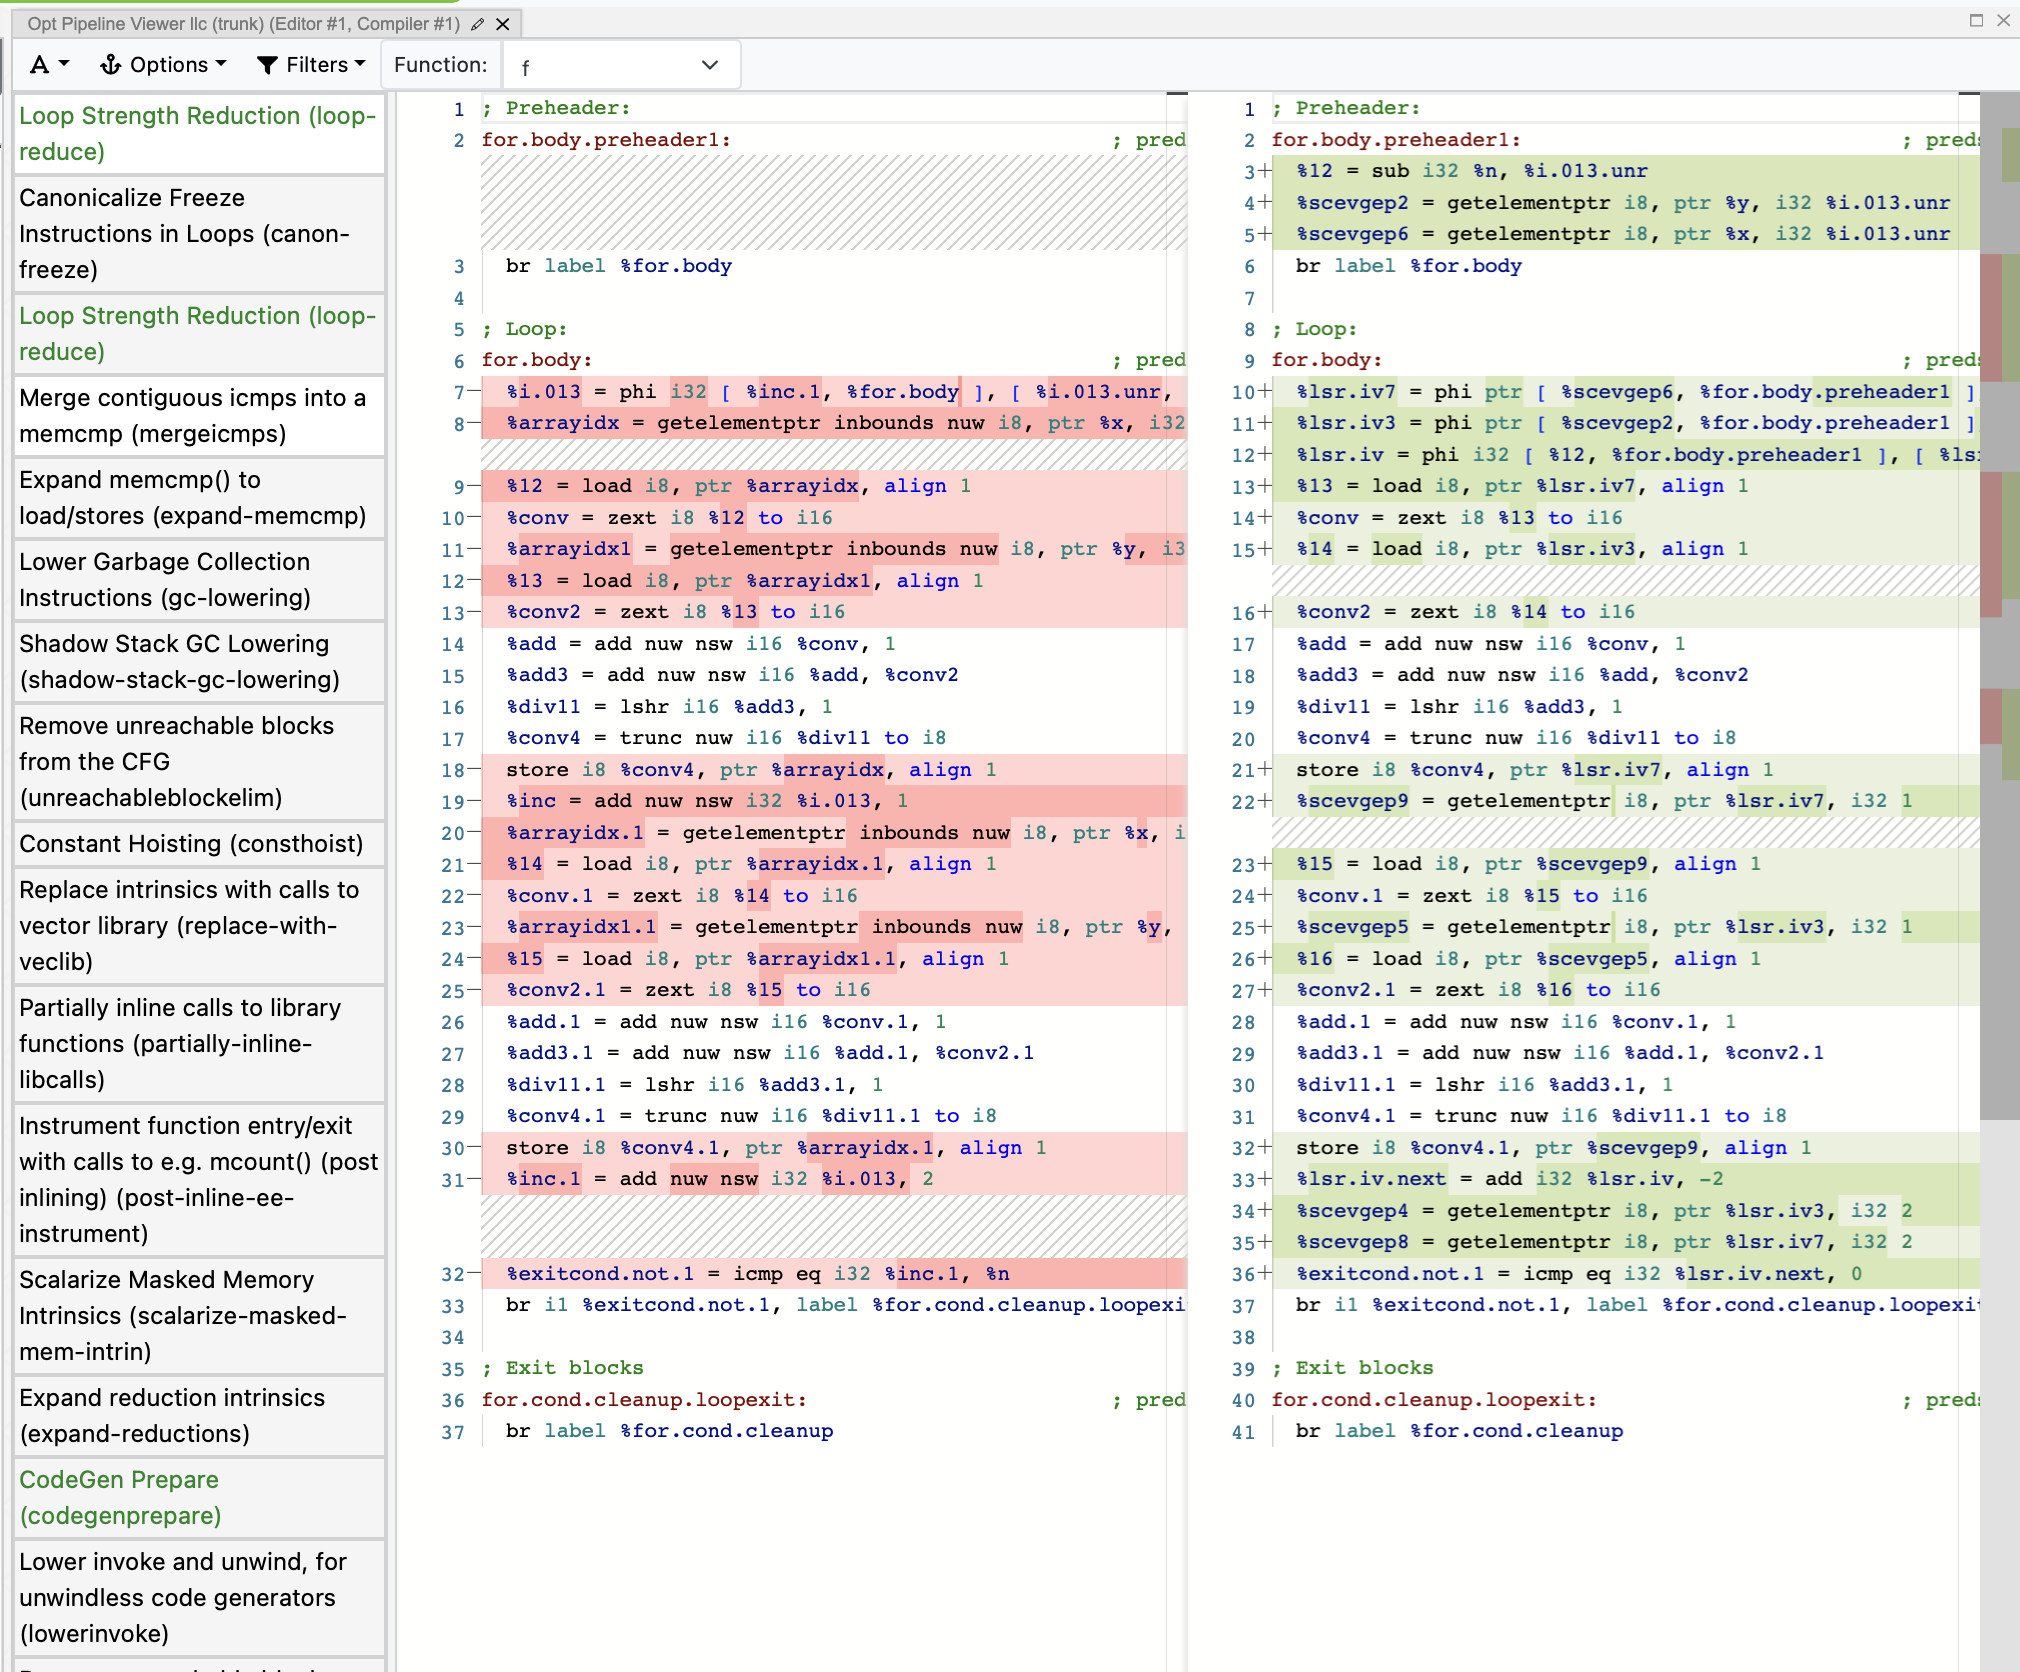
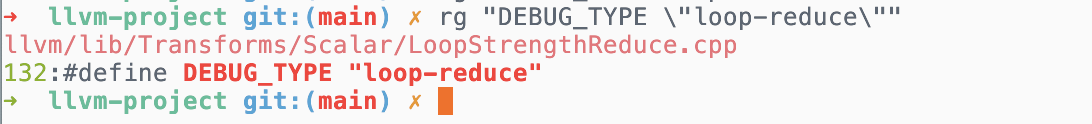
Inside the parenthesis, you can see the lower scored, dash connecting
name called loop-reduce. This basically acts as an ID for the pass. You can then ripgrep the codebase using this information
to guide you to a specific file that you can furthermore investigate.
 .
.
In the terminal, the aesthetics are not quite up to par. With assertion enabled, and with the option -print-after-all
(if you want to print out every pass) or -print-changed (print only the passes that changes the IR), you can technically
simulate the behavior of godbolt. There is also the option to print out the IR before and after a pass, with -print-before
and -print-after
Deep diving into a specific passes (locally)
After you've filtered out the specific pass that you think are affecting your code, you can also query it for more information with
-debug-only=<pass-id>. This works for both the opt and llc binary.
Here, the setup is done on the llvm-project main branch, hash of f9b9e9b7d52219842fb4386ee802762f83f2fabd.
My command is like before, through clang:
./build/bin/clang -S scratch/avgr_u.c -O2 \
-mllvm -print-after-all -mllvm -debug-only=loop-reduce &> test.txtThe -mllvm flags being put before -print-after-all and -debug-only=loop-reduce is so that the two actual flags can be passed
to either opt or llc. If you're ever curious about the input options to clang, opt or llc or the sort, instead of --help,
you can also pass in --help-hidden for all available options.
Here is the print-out for generic options if you ever need it :)
Generic Options:
-h - Alias for --help
--help - Display available options (--help-hidden for more)
--help-hidden - Display all available options
--help-list - Display list of available options (--help-list-hidden for more)
--help-list-hidden - Display list of all available options
--print-all-options - Print all option values after command line parsing
--print-options - Print non-default options after command line parsing
--version - Display the version of this programAnyways, back to the issue at hand.
Here, I have chosen to ask the opt pipeline to output the compiler's reasoning for the Loop Strength Reduction pass.
With the following C file and the following command line (remember to build the compiler with assertion if you want to try this yourself), the compiler generates the following relevant piece of information.
// avgr_u.c file
void f(unsigned char *x, unsigned char *y, int n) {
for (int i = 0; i < n; i++)
x[i] = (x[i] + y[i] + 1) / 2;
}...
New best at 7 instructions 4 regs, with addrec cost 2, plus 4 base adds, plus 6 setup cost.
Regs:
- {%x,+,2}<nuw><%for.body>
- {0,+,2}<nuw><nsw><%for.body>
- %y
- (2 * (zext i30 (trunc i32 (%n /u 2) to i30) to i32))<nuw><nsw>
New best at 8 instructions 4 regs, with addrec cost 1, plus 6 base adds, plus 6 setup cost.
Regs:
- {0,+,2}<nuw><nsw><%for.body>
- %x
- %y
- (2 * (zext i30 (trunc i32 (%n /u 2) to i30) to i32))<nuw><nsw>
The chosen solution requires 8 instructions 4 regs, with addrec cost 1, plus 6 base adds, plus 6 setup cost:
LSR Use: Kind=Address of i8 in addrspace(0), Offsets={0,0}, widest fixup type: ptr
reg(%x) + 1*reg({0,+,2}<nuw><nsw><%for.body>) + imm(1)
LSR Use: Kind=Address of i8 in addrspace(0), Offsets={0}, widest fixup type: ptr
reg(%y) + 1*reg({0,+,2}<nuw><nsw><%for.body>) + imm(1)
LSR Use: Kind=Special, Offsets={0}, all-fixups-outside-loop, widest fixup type: i32
reg({0,+,2}<nuw><nsw><%for.body>)
LSR Use: Kind=Address of i8 in addrspace(0), Offsets={0}, widest fixup type: ptr
reg(%y) + 1*reg({0,+,2}<nuw><nsw><%for.body>)
LSR Use: Kind=Address of i8 in addrspace(0), Offsets={0,0}, widest fixup type: ptr
reg(%x) + 1*reg({0,+,2}<nuw><nsw><%for.body>)
LSR Use: Kind=ICmpZero, Offsets={0}, widest fixup type: i32
reg((2 * (zext i30 (trunc i32 (%n /u 2) to i30) to i32))<nuw><nsw>) + -1*reg({0,+,2}<nuw><nsw><%for.body>)
*** IR Dump After Loop Strength Reduction (loop-reduce) ***
; Preheader:
for.body.preheader.new: ; preds = %for.body.preheader
%unroll_iter = and i32 %n, 2147483646
br label %for.body
...lldb and debuggers
A quick google on "gdb versus lldb" would give a similar generic answer to how similar the two tools are and it's often up to personal
preferences. I maintain the same view, but perhaps it is more beneficial to use lldb in the llvm codebase :)
Getting started
If you're new to LLDB specifically and LLVM in general, the lldb website gives pretty good direction.
It gives two options for newcomers: a tutorial and a cheatsheet of some sort to map GDB commands to LLDB commands.
Something interesting that I found out recently is in lldb, when you press Enter on the keyboard, you repeat the last command
executed. So if you're used to stepping through the code with n + Enter line by line, you can just press Enter after performing
n + Enter for the first time.
dump.*
The dump() helper function in llvm is basically a pretty printer for a class/struct.
Sometimes, if you're printing a variable foo through LLDB's p command, you'll end up getting back
the address of the class instead of the actual content, which you're interested in. To circumvent this, you can use the class's
dump() method when debugging:
- p foo // Don't do this
+ p foo.dump() // Do this to see a class's contentBesides the vanilla dump(), some classes also implement extra dump() methods. To explore more, you can try to perform the
following regex in llvm-project:
rg "void dump[^(\(\))]+\(\)"llvm/utils/lldbDataFormatters.py
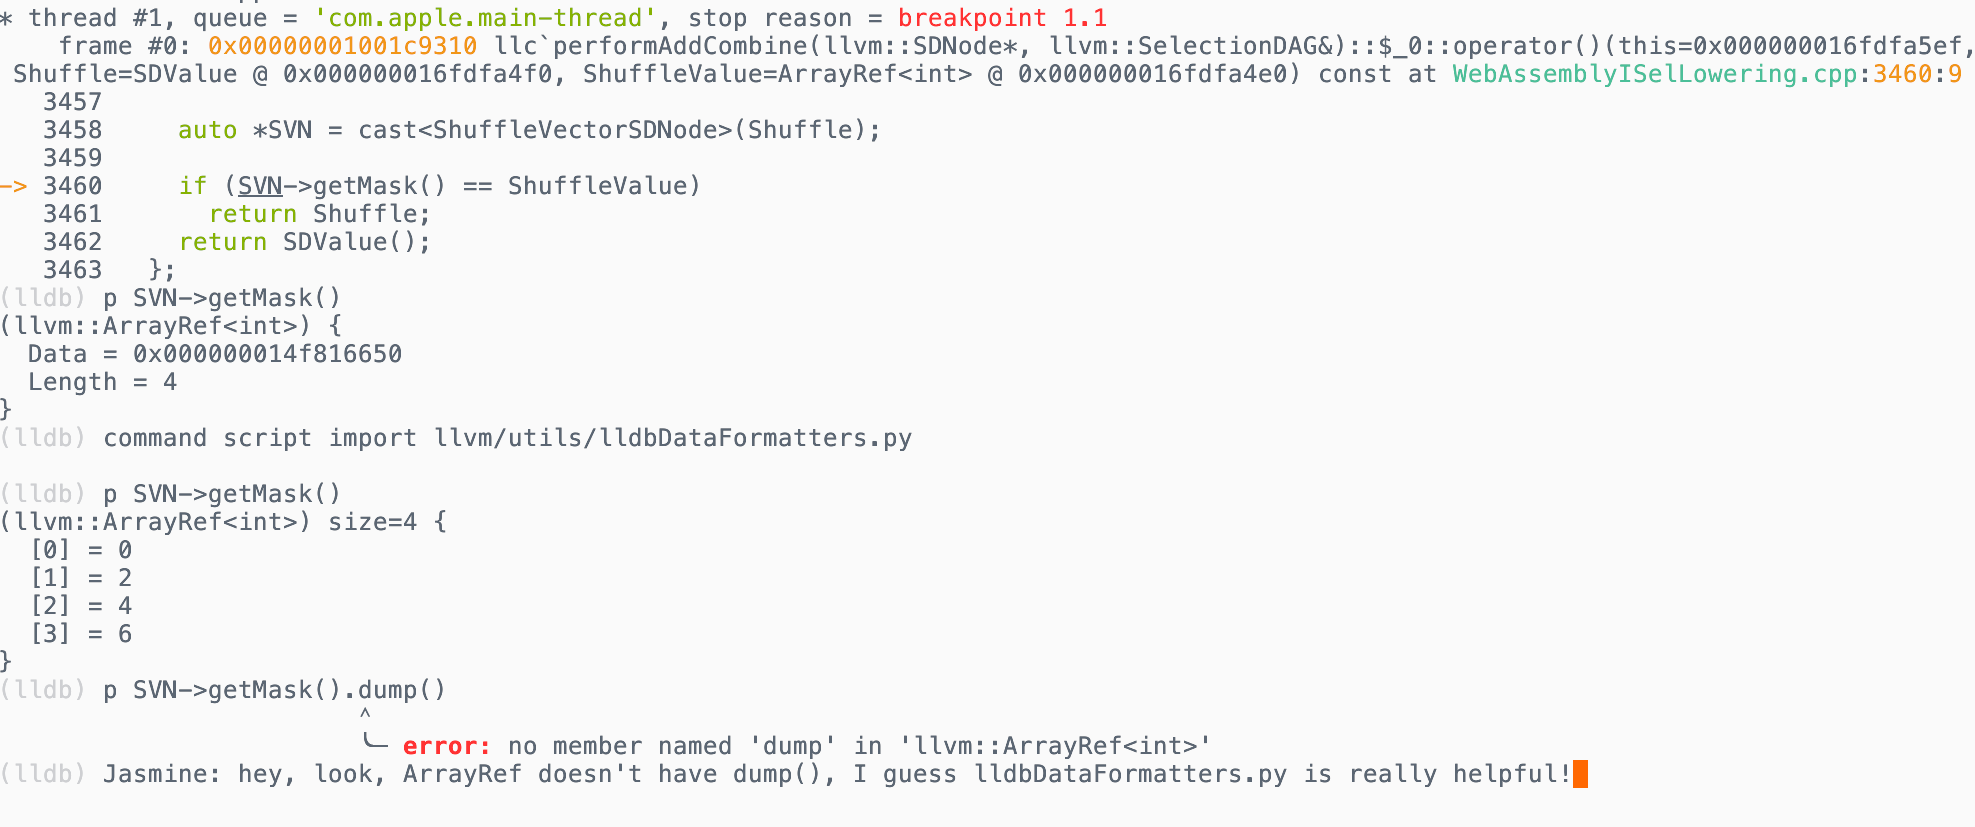
lldbDataFormatters.py (LDF) is a python script to integrate with LLDB. In LLDB, when you print a specific LLVM data structure
that doesn't have the dump() helper function, things can get a bit messy due to how the debugger's treating the data structure as
a pointer only.
For LLVM-specific data structures, LDF provides helpful pretty printer for DenseMap, DenseSet, StringRef, SmallVector, SmallStrings
To utilize the script, once you fire up LLDB, you can provide LLDB with command script import PathToScript/lldbDataFormatters.py
where PathToScript is the directory path to LDF.
For example, if you're debugging in llvm-project, which houses the lldbDataFormatters naturally in llvm/utils:
...
(lldb) command script import llvm/utils/lldbDataFormatters.py
...Here's a picture showing the before and after importing the formatter script:
Alas, a programmer would not be a programmer if not for their automation. It would be an inconvenience (and a detriment to their productivity) if a programmer were supposed to remember the script import command and then remember to type it in every time.
Instead, you can add this to .lldbinit in your home directory and let the computer perform said steps for you:
script
"llvm-project" in os.getcwd() and lldb.debugger.HandleCommand("command script import llvm/utils/lldbDataFormatters.py")Conditional breakpoints
A conditional breakpoint in LLDB is just like a normal breakpoint, except it only stops when some boolean expression you provide evaluates to true. So instead of halting every time execution hits that line or function, LLDB evaluates your condition first. If the condition is false, execution just keeps running.
I'm not quite sure how helpful the condition breakpoints are in LLVM. Personally, if I really need to have a condition
breakpoint in LLVM, I would rather construct a new if as my breakpoints.
I guess conditional breakpoints are more helpful for binaries that has already been distributed; nonetheless, I still want to introduce the option for newcomers.
In neovim, personally, I set up a keymap for this, so I don't have to type too much. Here's the lua code for the keymap if it peaks your interests.
local yank_for_conditional_break = function ()
local path = vim.fn.expand('%:.')
local line = vim.fn.line('.')
local word = vim.fn.expand("<cword>")
local result = 'breakpoint set --file '.. path .. ' --line ' .. line .. ' --condition ' .. '\'' .. word
vim.fn.setreg('+', result)
endTesting
Being a industry-ready project itself, naturally, every time a contributor open a PR, they must accompany the code changes with a test. Therefore, it's important to know at least on a high level, how testing works in LLVM :)
Fundamentals
Fundamentally, testing in LLVM is driven by three tools: lit, FileCheck
and llvm/utils/update_test_checks.py (UTC)
lit orchestrate how the tests are run (which compiler flags to use, which compiler executable to run), FileCheck determines if the IR generated by the compiler behaves as expected or not and UTC automatically updates the generated IR in the file to the newest iteration, reducing manual human costs when updating test case.
Below shows a simple test snippet (llvm/test/CodeGen/WebAssembly/simd.ll) that includes all three tools together:
; NOTE: Assertions have been autogenerated by utils/update_llc_test_checks.py
; RUN: llc < %s -verify-machineinstrs -disable-wasm-fallthrough-return-opt \
-wasm-disable-explicit-locals -wasm-keep-registers -mattr=+simd128 \
| FileCheck %s --check-prefix=SIMD128
; RUN: llc < %s -verify-machineinstrs -disable-wasm-fallthrough-return-opt \
-wasm-disable-explicit-locals -wasm-keep-registers \
| FileCheck %s --check-prefix=NO-SIMD128
; Test that basic SIMD128 vector manipulation operations assemble as expected.
target triple = "wasm32-unknown-unknown"
; ==============================================================================
; 16 x i8
; ==============================================================================
define <16 x i8> @const_v16i8() {
; SIMD128-LABEL: const_v16i8:
; SIMD128: .functype const_v16i8 () -> (v128)
; SIMD128-NEXT: # %bb.0:
; SIMD128-NEXT: v128.const $push0=, 0, 1, 2, 3, 4, 5, 6, 7, 8, 9, 10, 11, 12, 13, 14, 15
; SIMD128-NEXT: return $pop0
;
; NO-SIMD128-LABEL: const_v16i8:
; NO-SIMD128: .functype const_v16i8 (i32) -> ()
; NO-SIMD128-NEXT: # %bb.0:
; NO-SIMD128-NEXT: i64.const $push0=, 1084818905618843912
; NO-SIMD128-NEXT: i64.store 8($0), $pop0
; NO-SIMD128-NEXT: i64.const $push1=, 506097522914230528
; NO-SIMD128-NEXT: i64.store 0($0), $pop1
; NO-SIMD128-NEXT: return
ret <16 x i8> <i8 00, i8 01, i8 02, i8 03, i8 04, i8 05, i8 06, i8 07,
i8 08, i8 09, i8 10, i8 11, i8 12, i8 13, i8 14, i8 15>
}the RUN line tells lit to use llc with the following flags to spits out a LLVM IR file so that FileCheck can then take the
specific LLVM IR file and checking them with a specific prefix. The line that starts with ; Note or ; SIMD128 or ; NO-SIMD128
are all auto-generated by UTC to avoid human labors.
Here and there, a test will make no use of UTC and thus, you'll have you write it by hand. I'm therefore highlighting a few keywords to use in a test if UTC doesn't work for you.
Suppose the prefix is CHECK, then
CHECK:CHECKalone matches a subpart of a line.CHECK-LABEL: ensures that in a test case, only the string following theCHECK-LABELcan appear once. This is often used for function names.CHECK-SAME: esnures that whatever comes next ofCHECK-SAMEmust come on the same line as the previousCHECK-*line.CHECK-NEXT: ensures that whatever comes next ofCHECK-NEXTmust come after the previousCHECK-*line.
CHECK can also play with pattern matching, which is the special ingredient for a lot of handwritten test.
Suppose the ... is a regex pattern, and VAR stands for a variable name:
{{...}}: captures a text by some pattern specified by...without binding it to a variable.[[VAR:...]]: captures a text by some pattern specified by...and bind it to a variable calledVAR.[[VAR]]: references a variable that was bind before. Remember that this referencing is global; this means that if you reference the variableVAR, without capturing it by a regex first, you might be reference a variable that came from a test of another function.
Also remember that a regex pattern matches greedily instead of stopping at the first matched pattern, meaning if you just do
[[VAR:%.*]] : and nothing else, VAR might capture the furthest : from the % instead of the first :.
LLVM IR
A lot of the test cases in LLVM IR can be auto generated by UTC. There are a few cases where you'll encounter handwritten test cases combined with regex pattern matching.
MLIR
In MLIR, tests are more likely hand-written due to the natural evolving nature of the framework itself, together with the ever-changing syntaxes of dialect due to the natural evolving nature of the framework itself, together with the ever-changing syntaxes of dialects. Auto-updating all check lines would cause tests to churn massively and obscure meaningful changes.
MLIR maintainers want more pattern-based tests that cares for specific operations, attributes, or transformations, and provides more resiliency to syntax changes.
With this in mind, tests often requires ingenuity and are often opinionated by both the test writers and the reviewers. Of course, this would also mean tests are longer to write up, and if not meeting the threshold by reviewers, will be rewritten.
tablegen
For a short overview on tablegen, the LLVM tablegen docs cannot be more succinct:
TableGen’s purpose is to help a human develop and maintain records of domain-specific information. ... [reducing] the amount of duplication, the chance of error, and [making] it easier to structure domain specific information.
.td (tablegen) files are ubiquitous in the LLVM world; if you have contributed to LLVM, chances are you've read a .td file.
If something's wrong with a tablegen, a programmer needs to understand at least what a tablegen file will do.
A small tip to note is that when a .td file is table-generated, it spits out an .inc (include) file in the build folder. You can then manually
inspect this file to figure out a function's signature.
Developers often have a love hate relationship with tablegen, for example, with Jeremy Kun's perspective on MLIR's tablegen:
It sounds nice, but I have a love hate relationship with tablegen. I personally find it to be unpleasant to use, primarily because it provides poor diagnostic information when you do things wrong. Today, though, I realize that my part of my frustration came from having the wrong initial mindset around tablegen. I thought, incorrectly, that tablegen was an abstraction layer. That is, I could write my tablegen files, build them, and only think about the parts of the generated code that I needed to implement.
Personally, my experience with tablegen in the backend is akin to this: for certain issues/problems, if you don't use tablegen, then you'll end up writing more code and spend more time/effort maintaining said code. A problem with the tablegen language is that it is often up to each tablegen language consumer to interpret the language. I guess in a way, it feels more like a real, authentic language :)
I actually don't have much resource to provide here besides linking a really helpful thread on Google Groups here.
I'll be clipping the important part out for interested readers.
Thomas Lively: Part of the problem is that ISel patterns are like their own DSL inside the TableGen DSL, so keywords like "ins", "outs", and "ops" aren't keywords at the TableGen level, but rather at the level of the ISel system implemented with TableGen. Copying existing patterns and reading the comments in Target.td and TargetSelectionDAG.td are the best ways I know of learning how this works. I haven't seen a separate guide, although it would be very cool if one existed.
Matt D. Dziubinski also links some third-party resources in the Google group:
- "Lessons in TableGen" @ FOSDEM 2019 by Nicolai Hähnle
- The Tablegen series by Nicolai Hähnle
- Some of the parts of TableGen used in SelectionDAG are in the backend docs: instruction-set & instruction-selector
- LLVM backend development by example (RISC-V) @ LLVM Dev Meeting 2018 by Alex Bradbury
- "Building an LLVM Backend" @ LLVM Dev Meeting 2014 by Fraser Cormack and Pierre-André Saulais
- llvm-leg: LEG Example Backend
Edit: An official blogpost from LLVM raises a lot of the same points in this section.
Grepping tablegen
At the time of writing this article, with version 14.1.1, ripgrep provides a way to filter out the file type so often times, you can use this to exclusively search for tablegen files (.td).
I want to note that this extends to other file types as well, so if you want to exclusively search for LLVM-IR files (.ll), you can swap td:*.td' -ttd with
'll:*.ll' -tll.
rg --type-add 'td:*.td' \
-ttd "<What you want to search here" <where you want to search>Syntax highlighting
I'm not quite sure how applicable this is for the general audience (vscode & zed) but in vim/nvim, I did tablegen for quite a bit before adding on syntax highlighting for tablegen.
LLVM actually supply syntax highlighting for both vim/nvim and emacs. You can find your corresponding folder in llvm/utils.
For example
llvm/utils/vim/: For syntax highlighting in vim and neovim.llvm/utils/emacs/: For syntax highlighting in emacs.llvm/utils/vscode/: For syntax highlighting in vscode.
Language server protocols: the ultimate weapon
After reading to this section, some reader from the crowd frustratedly yells out: "Gah damn Jas what the hell is this? This not the stone age, why all we got from this article is grepping and syntax highlighting." And I agree, for a painstakingly long time, I'm also not aware that tablegen (and mlir) has already gotten an LSP server.
One thing that I want to note here for readers is that LLVM not only have the traditional clangd language server, it also has the tablegen LSP, MLIR LSP, and MLIR PDLL LSP. How cool is this!!!
With the tablegen LSP, I can hover over a definition to see how is a class in tablegen declared. I can also go to the declaration as well as find references to a specific instance/class. These tasks, which would mean a ton of grepping and manually looking through each file, would now be done at a click of a button.
The LSP page on the MLIR website details different features of the LSP as well as some demos with vscode.
For an overall look, the features include, but does not exclude:
- Live edit diagnostics.
- Go to definition.
- Find references.
- Code completion.
- Hover.
- Navigation.
At the time of speaking, vscode support and documentation are well documented on the website. I'm opening a pull request to add more documentation on how to set up these LSP on neovim here. As for zed and emacs, there is no current documentation on the page.
For my neovim readers, I'm linking how I set up the LSP in my dotfiles.
gitbisect
It is quite frustrating that on a big repository, after ~100,000 commits from you and a few thousands contributors, you're asked to solve a bug that happen on some new releases but not older ones. You say to yourself: "Welp I can't really build the llvm codebase and run the test case 100,000 times to find the commit that causes the bugs."
Instead, with git-bisect's binary search to find the commit that introduced a bug, you can reduce this down to
should spawn its own shell so git bisect run is not affected
The rest of this gitbisect section focuses on helping you set up a basic script to automate the bug finding process with gitbisect.
First, let's talk about the work flow. Git bisect requires 3 things
- A bad commit hash where the error occurs. Usually, when people file an issue on LLVM, they'll also provide you with this hash.
- A good commit hash where the error didn't occur back then.
- A script that returns zero or non-zero when recreating the original error for git-bisect to binary search on which commit the error first happens.
For lack of space, I link here a comment on an issue on how to perform git-bisect.
llvm-extract
Just like how it sounds, this tool extracts a piece of code that is of relevance from a big file to a smaller file.
For a demo as of Mon Aug 18 2025, you can build the llvm repository and input this command to the terminal. This will extract
the function ustest_f16i64_mm from a 1765 line of code file.
./build/bin/llvm-extract -func=ustest_f16i64_mm llvm/test/CodeGen/WebAssembly/fpclamptosat.ll -o - -SThe -S option prints out the LLVM IR instead of bitcode.
The -o - outputs the LLVM IR to the terminal directly.
Here is the new LLVM IR file after running the original file through the extraction tool:
; ModuleID = 'llvm/test/CodeGen/WebAssembly/fpclamptosat.ll'
source_filename = "llvm/test/CodeGen/WebAssembly/fpclamptosat.ll"
define i64 @ustest_f16i64_mm(half %x) {
entry:
%conv = fptosi half %x to i128
%spec.store.select = call i128 @llvm.smin.i128(i128 %conv, i128 18446744073709551616)
%spec.store.select7 = call i128 @llvm.smax.i128(i128 %spec.store.select, i128 0)
%conv6 = trunc i128 %spec.store.select7 to i64
ret i64 %conv6
}
; Function Attrs: nocallback nofree nosync nounwind speculatable willreturn memory(none)
declare i128 @llvm.smin.i128(i128, i128) #0
; Function Attrs: nocallback nofree nosync nounwind speculatable willreturn memory(none)
declare i128 @llvm.smax.i128(i128, i128) #0
attributes #0 = { nocallback nofree nosync nounwind speculatable willreturn memory(none) }llvm-reduce
Often, when a bug fails on a big test case, it is imperative to reduce the test case to a smaller one, so that other people can pinpoint exactly where
exactly the bug occurs.
The other way around also suffices. That is: you solve a bug, and then you want to reduce the llvm-ir test case to an acceptable size to ensure that PR reviewers don't have to sweat too much reading the test case and that other future changes in the codebase doesn't affect.
Here I give a minimal example on how to use llvm-reduce.
llvm-reduce works on the programmer telling it what test case execution is interesting. And in a unix fashion, if something returns a non-zero code,
it is considered interesting. With the same flow as git-bisect (minus the good and bad commit), by giving llvm-reduce a script that reproduces the error,
llvm-reduce then reduces the code down to a minimal example.
; BEFORE llvm-reduce
define i64 @stest_f64i64(double %x) {
entry:
%conv = fptosi double %x to i128
%0 = icmp slt i128 %conv, 9223372036854775807
%spec.store.select = select i1 %0, i128 %conv, i128 9223372036854775807
%1 = icmp sgt i128 %spec.store.select, -9223372036854775808
%spec.store.select7 = select i1 %1, i128 %spec.store.select, i128 -9223372036854775808
%conv6 = trunc i128 %spec.store.select7 to i64
ret i64 %conv6
}
; AFTER llvm-reduce
define <2 x i128> @stest_f64i64() {
entry:
%conv = fptosi <2 x double> splat (double 0x7FF8000000000000) to <2 x i128>
ret <2 x i128> %conv
}If you're interested in learning more about how to reduce LLVM crashes, nikic has a great article on this.
Reading skills and experience
Often times, an issue might be too hard for somebody just because they haven't encountered the issue before, or they haven't read up the codebase or research the specific knowledge yet.
Nothing wrong with that, first times are always hard. I think the important mindset is to adopt is that it's ok to go back and try again, nothing needs to be perfect. Sometimes a technical article is just too hard, so I just give up and try again the next day or the next week hahhhahha.
In this section, I'll also share some resources I've consumed throughout my two months at Igalia.
- 2024 LLVM Dev Mtg - A Beginners’ Guide to SelectionDAG
- LLVM Language Ref
- How to contribute LLVM
- Legalizations in LLVM Backend
- Tablegen docs
- ClangIR
- RISCV Vector Extensions
- WebAssembly Specs
- How to reduce LLVM crashes
- Clear step by step to oneshot debugging any LLVM issue with ChatGPT
- Git manual
- LLVM lang ref
- How to contribute to LLVM
- Building LLVM with CMake
Asking people for help
If even after you've read the article, and you're still not sure how to solve an issue, there's no shame in asking other people for direction and for help :)
I think sometimes, seniors have trouble helping juniors out with a problem because neither of them have taken a jab at the problem yet. Seniors haven't because they're often busy solving problems at a greater scope and juniors haven't because they're often not briefed on where and how to take a jab of it. Hopefully with the tools presented in this article, I can help bridge the gap between the two parties; before going to seniors for help, isolating incidental functions and/or files and providing crucial log files would prove very useful for both sides :)
Personally, I'm very thankful for both the open source community and my colleagues at Igalia for guiding me on my path of learning LLVM and helping me out with issues and pull requests. It would be treacherous and nigh-impossible without them :)

Epilogue
Welp, that's it for this one :) In writing this blog, here's what I hope to achieve with the blog. For newcomers, the article will act as a guiding point to help them get started with problem-solving in their LLVM journey. For seniors, I hope that you can help me contribute to this blog by either sending me resources through discord or giving me feedbacks on which part to improve.
I want to thank Igalia for allowing me to write this blog on company time :) I really enjoy writing the blog and would love to write new blogs in the future hehehehh.
Keep on keeping on everyone :)