[ONGOING] Profiling and optimizing sccache (via Bazel)
2026-07-27
Prologue
Hi everyone, how is everyone doing? Gosh it's been two months (TODO REDO) since my last post with Nix. I hope everybody's doing ok. This May i've moved to Somerville, MA and it's a new experience compared to where I'm from, OC, CA. The city is much more walkable, and there's more public transit :) People seemed friendlier and nicer. Also, there're many more trans ppl hahahah. That makes me really happy :)
This blog is about the time I learned how a caching system works, how I perform perf-ing on sccache and how much I
had improved sccache :) I hope everybody enjoys.
As is tradition, here's two songs for you: Cơn Bão Nghiêng Đêm and https://youtu.be/LpXWfvun7DM?si=qj_UdBJTGREwUaKx
Introduction
Caching is an integral part of the incremental workflow: a caching binary needs to process a compiler's command and then figure from the command, which part it needs to cache and how it's gonna cache it. While helping set up the necessary toolchains to build a large scale production app via Bazel, more specifically rules_foreign_cc(rfcc), I've found that caching on a sandbox-based build system is extremely tricky and performance-restrictive. This blog, then, is about my journey of improving the performance of sccache under bazel.
TODO: Figures about how much W is improving from stock to nondirect to direct mode.
180 -> 67 -> 30 ???
This is counting rfcc's configure_make's configure's about 15 seconds, so its more like 165 -> 52 -> 15
180/30 = 6 165/15 = 11
Context
We should talk a bit about bazel and rules_foreign_cc (rfcc). An experienced Bazel user might ask: "why add sccache to Bazel already natively supports its action-based caching?"
While the statement is true, if your favorite library is not available natively as a bazel dependency, you'd find that the action-based caching offers no real advantages. This is because to interact with libraries from other build systems such as make, configure, cmake and meson, we'd need to use rules_foreign_cc to form a pathway between them and bazel. By doing this, dependencies built with rfcc only have one big opaque action instead of having its action split finer. This means that if we are to speed up these rfcc-built libraries, we'd need to reach out to sccache (or cache) for help.
The following two sections are divided into two categories: first one is Misc optimization: stuff that can be found via either LLM, inspecting sccache's server.log or performing tracebox on the bazel build command itself.
The profiing was performed on my local machine, here's the screenshot of its fastfetch for specs:
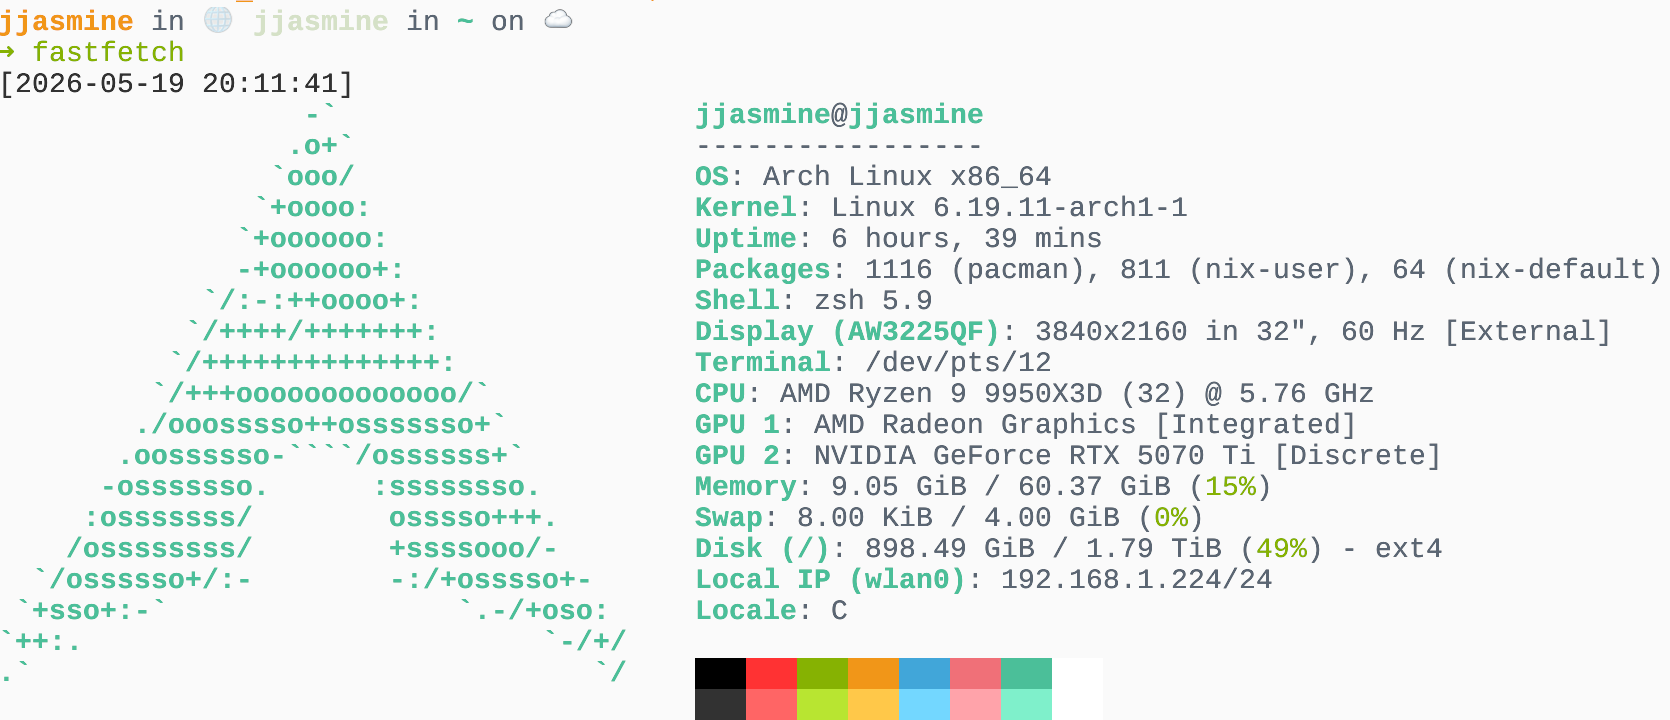
Performing profiling on a strong machine (at the time) brings both positives and drawbacks:
- Much faster rebuilding and profiling time: I can iterate much faster and deliver results in record turn around time with my crackhead-level RAM, SSD and CPU.
Misc optimization
These are optimizations that I was able to obtain by either: using tracebox or just by reading the code or grokking the server.log that is present when you turn SCCACHE_DEBUG: true as an environment variable
Num thread in client-side tokio
When tracing the build of libx11 via tracebox and performing some generic SQL queries, I noticed that tokio's threads are responsible for a significant amount of total thread count. Asking the LLM to trace the codebase, I've noticed that a new sccache client's tokio spawns a full 16 thread (or what your CPU count is) every time it tries to send a request to the sccache server.
After tuning the thread count start up number, re-tracing libx11 via tracebox, I observed a drop from ~3000 tokio threads to ~300 tokio threads. Timing the build itself, the versions before the fix and after the fix finished in roughly the same time; there wasn't any meaningful gap that shows this really matters. I suspect this is because my PC is just too performant and couldn't be bottlenecked under the small scale of rebuilding libx11, or that the portion of tokio thread's overscheduling is too short so this optimization really doesn't matter much.
After I've confirmed that the fix worked via tracebox, I'd filed the PR for this issue at https://github.com/mozilla/sccache/pull/2716 but was unaware that there is already another PR like this in https://github.com/mozilla/sccache/pull/2704.
Lessons learned, next time I guess I should just spend 30 minutes grepping the PR lists before I went through this fiesta of profiling hahaha.
Missing flag: no-cxx-modules
Ah this one is a classic. Internally, when sccache scans over the argument of the compiler invocation, if there are some unknown flags that is not registered to the global ARGS table, sccache will deemed it too hard to perform the cache and will bail out.
/Users/jjasmine/Developer/igalia/sccache/src/compiler/args.rs:614 /Users/jjasmine/Developer/igalia/sccache/src/compiler/gcc.rs:582
Path normalizations in meson
Asking the LLM to perform grepping on the server.log file (I can't do this by hand the server.log is a 100mb file of text), I discovered that there were some path normalization issues with meson. The project being affected was glib: sccache would sometimes refuse to translate the ".." in a path to refer to parent directory of the path and would just omit the "..". This means a path such as "build/../src/" would be incorrectly normalized as "build/src" instead of "src"
After I had implemented the fix and upstreamed it, I also found out that somebody else had mentioned encountering the exact same issue. Fortunately (or not), there wasn't any PR opend for this.
I've opened the pull request at https://github.com/mozilla/sccache/pull/2719 and am currently awaiting the maintainers' response.
Skipping sccache in configure
It is important to keep in mind how sccache is hooked up in bazel's rfcc. In our bazel codebase, we wrap sccache around every rfcc's toolchains' compiler. This means that even for simple configure checks, we still have to incur the cost of setting up the sccache client's tokio server just to send a request, and then we'll have to wait for the TCP overhead, and of course, the cache miss from configuration will just make the server have a thread forked and exec'ed to compile the simple configure check. Redundant round trips like this, over the stretch of 10 or 20 dependencies, contribute to a sizable time increase.
We can, of course do xyz but bla bla bla in the end we maintain a thin bash script wrapper between the toolchain's
compiler and sccache. When it's configure time, we pass in SCCACHE_CONFIGURE = 1 to the bash script's environment
variables, if the script sees that the variable is defined and/or is true, it skips sccache and just run the
non-sccache-wrapping compiler invocation.
I'm not sure how to perf this change so what I ended up doing was just set up a dependency chain of 3 configure-heavy dependencies, rebuild them under skipping sccache for the configure stage versus not skipping, and the results were pretty promising:
TODO: add data
Perf Case studies optimization
Non direct mode vs direct mode
When profiling a sample build with sccache in nondirect, I observed that, the majority of the time is taken up by page faults. I'm not sure what to make of this, but it seemed to me this might occur because in nondirect mode of sccache, sccache needs to use clang to perform preprocessing. Forking and exec-ing a new compiler instance for preprocessing requires loading the new clang executable (150mb) into userspace, leading to a lot of unavoidable page faults.
The next endeavor to optimize sccache would be: direct mode.
For context here, when we talk about non-direct mode versus direct mode, we mean direct as: "Can sccache skip the preprocessing step, by directly hashing the related ingredients that will influence a compiler command?"
Here comes the problem with bazel: on every dependency, bazel copies the necessary tools and libraries and source files to build the dependency into a separate folder before copying back the output back. After this, the sandbox is either stashed away (moved to another path) or teared down.
This means that for direct mode, since the same dependency being built will be spawned in different paths each time, sccache cannot cache the preprocessor output so
generate_hash_key is actually generating the preprocessing output as the hashkey (in the non direct mode case), dont get mistaken
Let's take X as an example.
https://github.com/GrapheneOS/hardened_malloc
musl-malloc versus mimalloc
This case study was first performed when sccache was built with musl malloc. When compiling a LLVM-sized library with multiple dependencies from scratch, with sccache turned on, musl malloc suffers some performance hits from the singular global malloc lock (15% of at least in userspace perf)
My decision was to either switch to some other industry malloc libraries, such as glibc, jemalloc or mimalloc. I ultimately picked mimalloc due to it being a shinier new toy and its portability.
Surprisingly, the warm-cache codebase compilation time increases from around 267 seconds (musl) to 300 seconds (mimalloc), with the malloc global lock overhead gone, overshadowed by a 7% occupation of fork syscall in sudo perf.
I was really perplexed. "Shouldn't the shinier, newer toy beat the old musl?". It turns out that this is accompanied by two causes.
-
sccache's jobserver uses the passed in binary via its fork-exec pattern. Although modern OSs use the copy-on-write (COW) technique to reduce page table copying between parent and child processes, there might potentially be some small writes to some pages in the window between the fork syscall and the exec syscall, causing copying of the pages to happen.
-
mimalloc, with its configuration option, turns on its Transparent Huge Page by default. Compared to musl's 4KB page size, mimalloc has certain pages with size of 2MB. This with fork/exec might, together the first point, cause more memory congestion than versus say the pages with size of 4KB.
To fix this, we can either perform one of two things:
- We can first, disable transparent huge page. This will make it so fork exec doesn't have to deal with 2MB pages anymore.
- We can modify the sccache codebase so we don't have to use fork exec anymore
This happens, (i think) because mimalloc pre-allocates (TODO: Source the
readme.md and the code as well)
mi_process_init_once at /Users/jjasmine/Developer/igalia/mimalloc/src/init.c:629 ???
maybe check arena
unix/prim.c ->
TODO can you check if this is because of THP? like will THP cause fork/exec degradation
The gist is the per project fix would be: no thp. but the best fix that applies to all the projects would be do
posix spawn on serversTrivias
To avoid locking for single-threaded processes, musl introduces a process-level libc struct at src/internal/libc.h, with
its need_lock set by pthread_create to 1, otherwise 0. In src/malloc/mallocng, which is the newer version of malloc,
it defines #define MT (libc.need_locks) and checks for MT before each locking operation, a quicker operation than
locking.
In musl/src/internal/lock.h, the header defines hidden void __lock(volatile int *); but defines and uses int __malloc_lock[1] as the input to said function. This, I guess is that an array automatically decays to a pointer.
If we were to only to define a global variable, we'd need a & in front of every said function call.
musl malloc()
Regrets
Hahahah, alas, it seems life is not as perfect as the blogs make it out to be. Throughout this project, I really did regret a few things that I had wished I did sooner or differently.
Lack of experience and habit (lol)
To start with the regret section, I wish I had done some profiling before. I think some serious exposure in profiling would have prevented some of the following mistakes. Nevertheless, valuable lessons were learned.
I also think trying to cultivate a habit of reading new code repos would have done me good. A few light read of musl libc and sccache every now and then would have saved me a couple of hours. I wish I had treat reading codebases like reading a book. I mean they're both reading right? hahhahahh
Not setting up the build process from the start
At the start of the optimization project, what I did was maintaining my own personal fork of sccache in a folder
separate from our repo for building the application. Then I would cargo build and cp the binary to replace the
prebuilt sccache that was in the main repository. This means that when it's time to integrate sccache to the
build system side of building the application, a lot of toolchain-specifics side effects that shows up in the perf
profiling are not there anymore.
Not setting up an automatic recorder / Not rigorously tagging my git commit
Throughout the course of the profiling project, I was profiling data by running a script that:
- runs the non-sccache-based workload and the sccache-based workload
- packages only the perf data, the sccache server log and the bazel's --profile inside a .tar.gz file named
sccache-data.
I then would extract the data to a separate dedicated folder that I manually name, something like
sccache_v14_app_newjobser_muslmalloc_nobacktrace, coupled with a quickly written readme.md that describes (to me)
what was different in v14 from v13 or v12.
Although this bash script automation formed a core part of my profiling, in retrospect, it was definitely not up to spec
to form a rigorous enough profiling workflow. The v14 was supposed to describe which iteration of sccache that I was
benchmarking on, but this could have been easily avoided if I had just copy and paste my list of downstream-dedicated
commits. The _app_newjobser_muslmalloc_nobacktrace part was supposed to detail which features was different from the
previous version would have been made redundant by copy pasting of downstream-dedicated
commits.
I wish I had prefixed all my commits with "[downstream-sccache]" and then automated the context-collection by
- automatically git grep all the commit prefixed with "[downstream-sccache]" so I can automatically have all the objective context that I (or any engineers) need while profiling. I call this the intrinsic context (happening inside the sccache codebase).
- automatically neofetch/fastfetch, so other people can understand what system I'm on, together with the current
snapshot of
htop/btopso I know what my system baseline is before running the perf (extrinsic context). - automatically record the sccache config used, or other extrinsically influencing factors besides the commit itself, as well as the perf command itself (if I were running perf instead of just timing and comparing the workloads)
Failure to self-realize a standardized path to profiling sccache from me has caused a great number of unintentional obstructions of profiling context and information to the team, which I greatly regret.
Profile it rather than time it
I also noticed during this period, a lot of the time was wasted timing the bazel build. I would modify something in sccache, compile the sccache binary and then run the workload again by hand just to see what is the delta on build time between sccache change is. Not only does this make In retrospect, I should have reach for perf when I first learned that this was an optimization problem. Instead, I clutched to bazel profile for a while, hoping that the proxy effects of modification of sccache will show up in the total time measured.
https://sigops.org/s/conferences/hotos/2025/papers/hotos25-414.pdf
AI Usage in profiling
Ultimately, there comes a question of some sort like "can the LLM do this?" or "how much can the LLM help here". My answer here would be: not much, but kinda, the LLM cannot produce meaningful directions and cannot take charge of the profiling, but it can help iterate
Here's an example. After I'd switched from musl malloc to mimalloc and observed degrading performance, if I hadn't performed the perf myself, read the mimalloc paper and its README.md, and asked the LLM to redo the jobserver, I wouldn't have discovered the gains coming from posix_spawn.